Housing Market Recovery Index Highlights
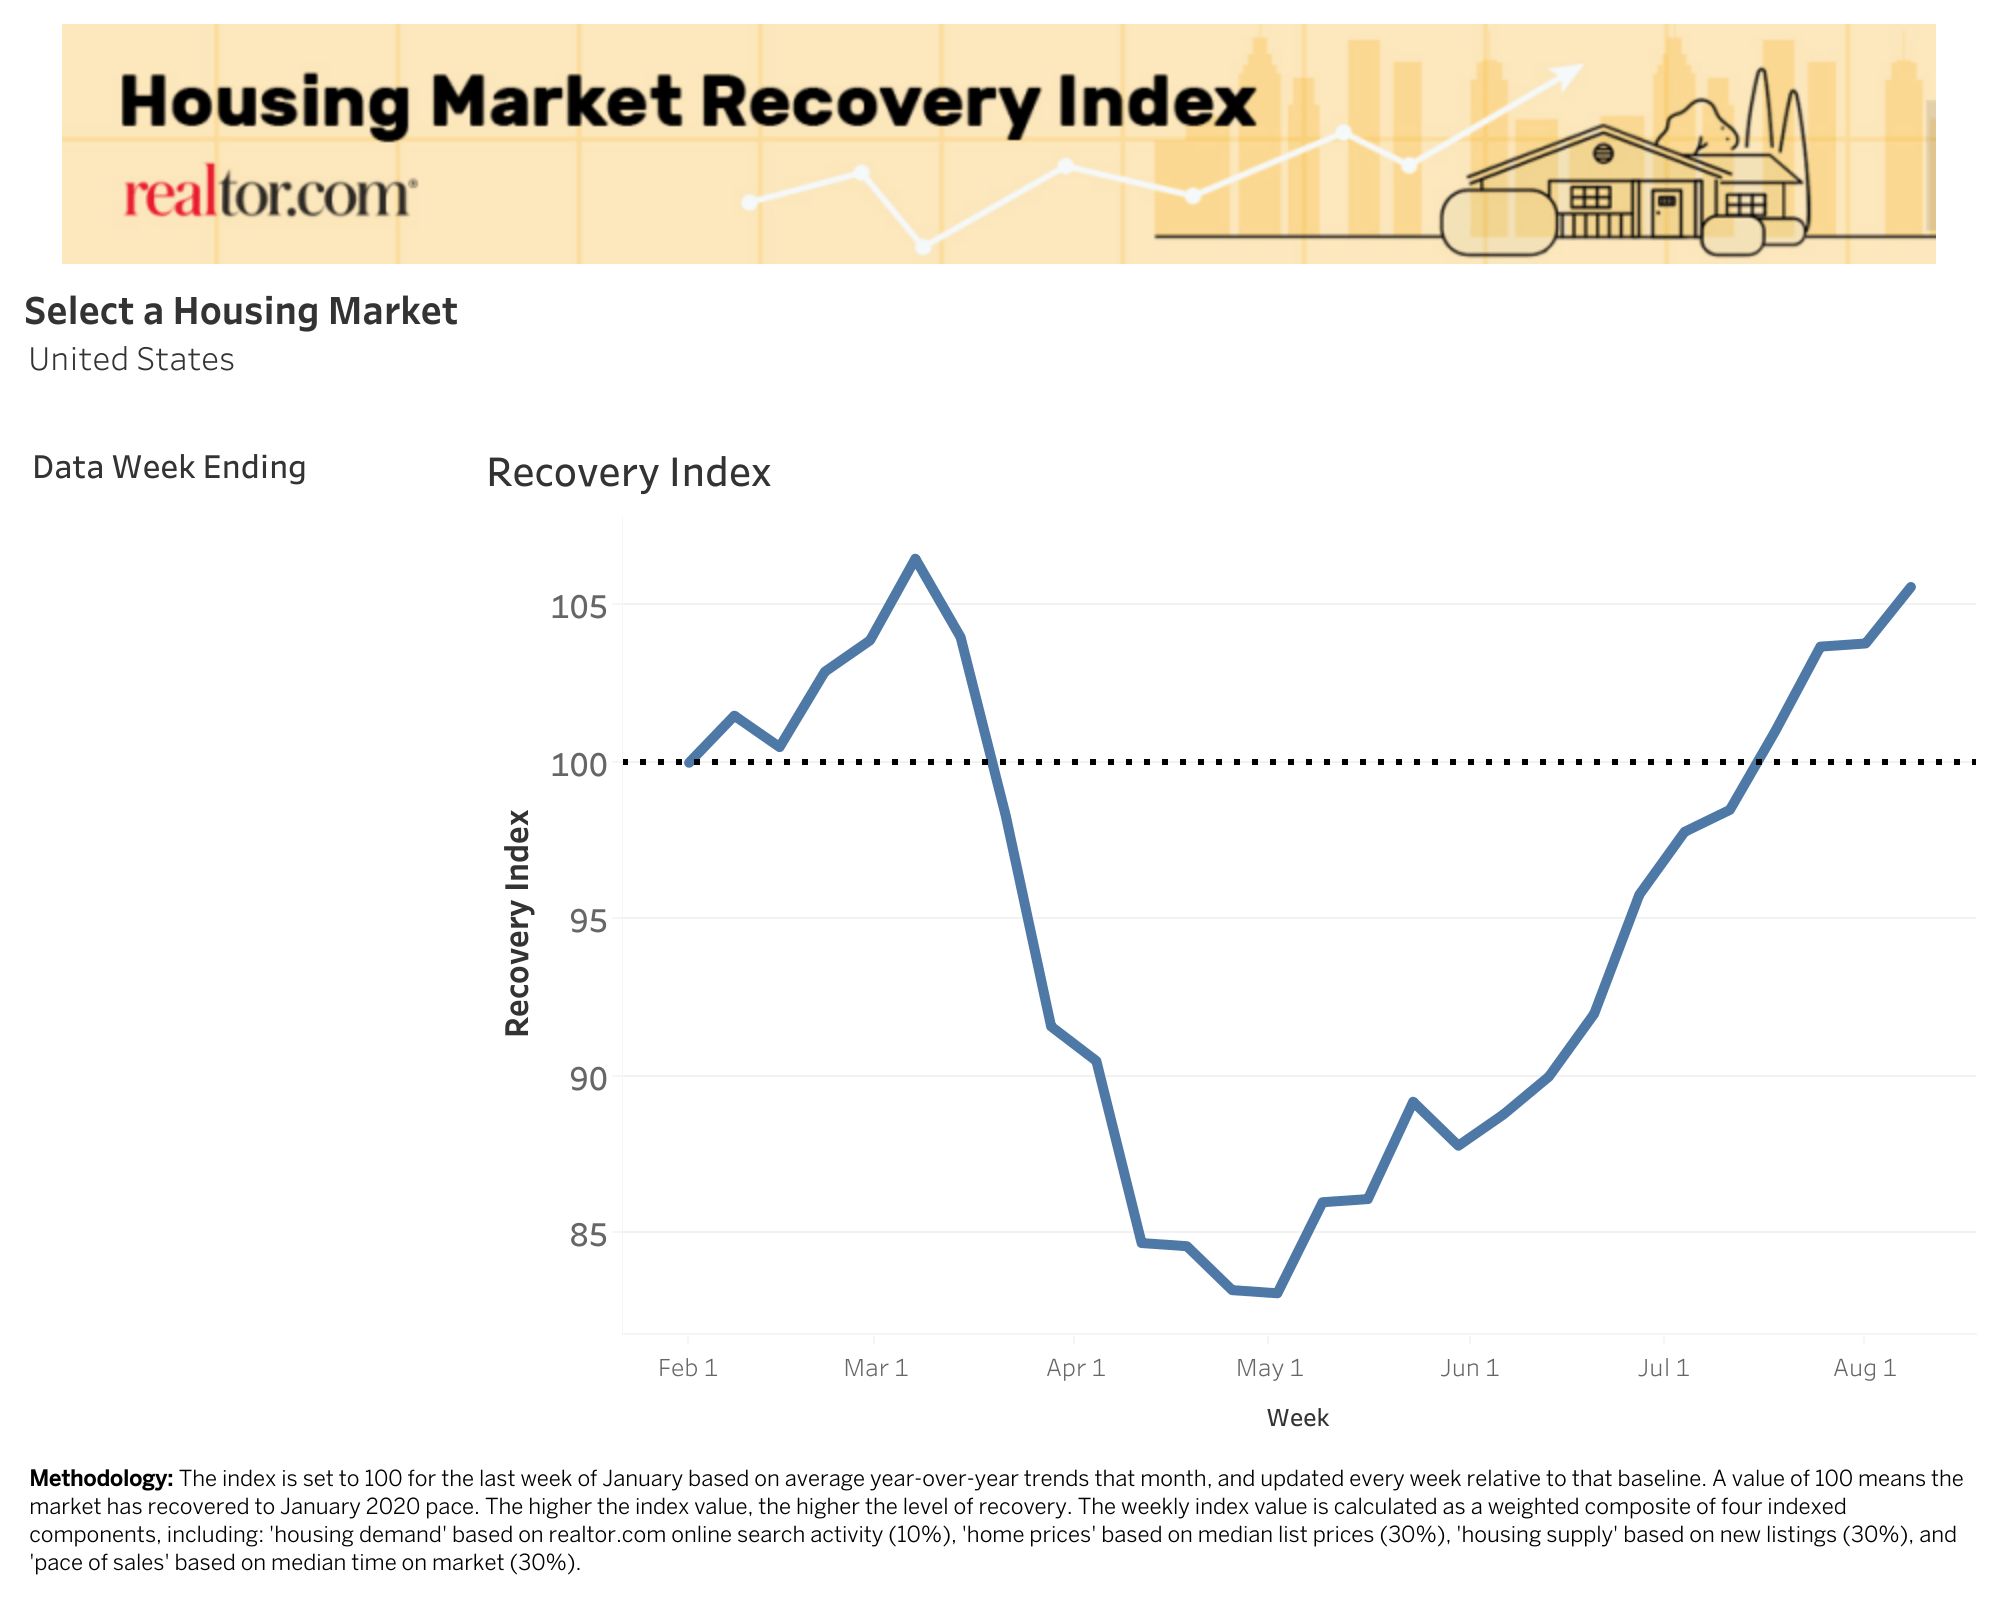
- The realtor.com Housing Market Recovery Index reached 105.6 nationwide for the week ending August 8, posting a 1.9 point increase over last week and 5.6 points above the pre-COVID baseline.
- The new supply component reached 101.7 nationwide, crossing the recovery threshold for the first time since March.
- Regionally, the South joins the West and Northeast recovery while as it has finally crossed the pre-COVID benchmark.
- Locally, a total of 34 markets have crossed the recovery benchmark as of this week. The overall recovery index is showing greatest recovery in Las Vegas, Seattle, Boston, New York, and Denver.
Download the full Housing Market Recovery Index dataset here.
National Recovery Trends
Making up for the lost spring home buying season, the housing market continues to heat up this summer. For the first time since the pandemic began, all four major components of housing activity are growing above the January pace. The realtor.com Housing Market Recovery Index reached 105.6 nationwide for the week ending August 8, posting a 1.9 point increase over last week and 5.6 points above the pre-COVID baseline. Crucially, this week’s move takes the new supply growth past the recovery threshold for the first time since March, with the supply component reaching 101.7 nationwide.
After seeing other measures of growth recover over the past few months, the final piece of the housing recovery puzzle appears to have fallen into place. Growth in housing demand, asking prices, and the pace of sales had all crossed the recovery boundary in sequence, but new listings remained the missing link. Effectively, it’s taken nearly five months for sellers to make a full return into the housing market.
Seller confidence had been improving gradually after reaching the bottom in mid April, and now it appears to have reached an important milestone. While encouraging, the improvement to new listing growth is only the first step of many needed to solving inventory woes for buyers. More new properties for sale is a good sign for home shoppers, but so is the price mix of the homes entering the market. Price gains are visibly outpacing pre-COVID levels despite pandemic and economic fears.
Much uncertainty remains in back-to-school plans, lockdowns and the overall employment situation. The broad move above recovery was much needed for housing. Importantly, it will need to hold and improve through the end of the year to make up for the spring season disruptions. The next few weeks going into the fall are key in assessing the extent to which the market can recover lost ground.
| Week ending 8/8 | Current Index | W over W Change |
| Overall Housing Recovery Index | 105.6 | +1.9 |
| Housing Demand Growth Index | 118.5 | +2.4 |
| Listing Price Growth Index | 106.2 | +0.5 |
| New Supply Growth Index | 101.7 | +4.9 |
| Pace of Sales Index | 104.7 | +0.1 |
The ‘housing demand’ component – which tracks growth in online search activity – remained visibly above recovery, with this week’s index reaching 118.5, up 2.4 points over the prior week and 18.5 points above the January baseline. Home buyer interest continues to outpace last year levels as detected on realtor.com over the last few months. While overall home buyer sentiment appears to be stabilizing due to record-high prices, short supply and economic headwinds, low mortgage rates continue to open the window to home ownership.
Powered by a backlog of demand, the ‘home price’ component – which tracks growth in asking prices – increased by 0.5 points last week, and is now at 106.2, 6.2 points above the January baseline. With supply at record lows and buyer competition on the rise, sellers have regained leverage, enabling the fastest price growth recorded since January 2018. As inventory and foot traffic grow through the end of the summer, we’ll get a good indication of whether higher asking prices will translate into higher selling prices.
Notably, the ‘pace of sales’ component – which tracks differences in time-on-market – saw continued signs of improvement for the eighth week in a row and continues to remain above the pre-COVID baseline. The time-on-market index reached 104.7, up 0.1 points from last week, and 5.7 points above the January baseline, suggesting buyers and sellers are connecting at a faster rate and setting up the peak home buying season this August.
The ‘housing supply’ component – which tracks growth of new listings – reached 101.7, up 4.9 points over the prior week, finally reaching the January growth baseline. The big milestone in new listings growth comes as seller sentiment continues to build momentum even as buyer sentiment begins to stabilize. After constant gradual improvements since mid April, seller confidence appears to be reaching an important milestone. The temporary boost in new listings comes as the summer season replaces the typical spring home buying season. More homes are entering the market than typical for this time of the year, but further improvement could be limited going into the fall as the peak cycle subsides.
Local Recovery Trends
The West Retains Momentum as the South Finally Moves Past Recovery Threshold
Regionally, the West (111.3) continues to lead the pack in the recovery, with the overall index now visibly above the pre-COVID benchmark. The Northeast (106.2) remains above recovery pace but declined slightly this week, while both the South (102.1) and Midwest (99.1) saw an improvement in market conditions.
Social distancing and economic resilience continue to be key factors driving local differences in the housing recovery. Per our earlier research, the spread of COVID-19 is closely linked to the housing slowdown, with markets with higher cases per capita more likely to see a bigger impact on supply and the pace of sales. The speed and sustainability of the reopening, and each market’s ability to contain COVID-19, are dictating the speed of recovery across the regions. Finally, resilient economies may have an edge in the housing recovery, and areas with strong job markets before COVID-19, especially those with thriving tech sectors, are seeing buyers and sellers reconnect faster than the rest of the country.
| Region | Avg Recovery Index(week ending 8/1) | Weekly Change |
| West | 111.3 | +0.8 |
| South | 102.1 | +2.6 |
| Northeast | 106.2 | -2.0 |
| Midwest | 99.1 | +0.3 |
…
34 of 50 Largest Markets Now Above the Recovery Benchmark
Locally, a total of 34 markets have crossed the recovery benchmark as of this week. The overall recovery index is showing greatest recovery in Las Vegas, Seattle, Boston, New York, and Denver, with the components of growth surpassing or approaching pre-COVID benchmarks. Markets in the sunbelt (Florida, Georgia, Louisiana, Alabama) with re-emerging COVID concerns and parts of the midwest (Michigan, Indiana, Wisconsin) with vulnerable economies are experiencing slower recoveries.
In the ‘housing demand’ component, 49 of the 50 largest markets are positioned above the recovery trend. The most recovered markets for home-buying interest include Riverside-San Bernardino, Sacramento, New York, San Francisco and Kansas City, with a housing demand growth index between 134 and 140.
In the ‘home price’ component, more than half of markets are now positioned above the recovery trend, with 27 of the 50 largest markets seeing growth in asking prices surpass the January baseline, two less than the previous week. In the top 10 most-recovered markets, asking prices are now growing at 11 percent year-over-year, on average. The most recovered markets for home prices include Cleveland, Pittsburgh, Louisville, New Orleans, and Austin, with a home price growth index between 108 and 114.
In the ‘pace of sales’ component, 32 of the 50 largest markets are now seeing the time on market index surpass the January baseline, down from 36 last week. In the top 10 most recovered markets for pace of sales, time-on-market is now down 20 percent, on average, year-over-year. Interestingly, markets where time on market is recovering the fastest tend to be faster moving than those with a slower recovery, suggesting seller markets pre-COVID may be better positioned for recovery in the months ahead. The most recovered markets for time-on-market include Boston, Las Vegas, Los Angeles, Virginia Beach, and Baltimore, with a pace of sales growth index between 126 and 134.
In the ‘housing supply’ component,24 of the 50 largest markets saw the new listings index surpass the January baseline, up from 19 last week. Interestingly, markets where new supply was improving the fastest tended to be higher priced than those that had yet recovered, suggesting sellers were returning faster in the more expensive markets. The most recovered markets for new listings included Las Vegas, Seattle, San Jose, Phoenix and San Francisco, with a new listings growth index between 129 and 147.

How to read the index – the overall index is set to 100 for the last week of January based on average year-over-year trends that month, and updated every week relative to that baseline. A value of 100 means the market has recovered to January 2020 pace. The higher the index value, the higher the level of recovery. The lower the index value, the lower the level of recovery.
Source: Realtor.com Javier Vivas
Director of Economic Research, realtor.com®

